Recap
Think of your BtrBet Recap as your strategic vantage point in the world of sports betting. Here, your betting history transforms into a dynamic map of insights, where patterns emerge from chaos and hunches crystallize into evidence.
Filter your journey through custom tags that track everything from model performance to gut feelings, slice your data across books and sports, or zoom out to see the bigger picture of your bankroll’s evolution.
Whether you’re fine-tuning a proven strategy or uncovering blind spots in your approach, your Recap reveals the story your bets have been trying to tell you all along.
Summary view
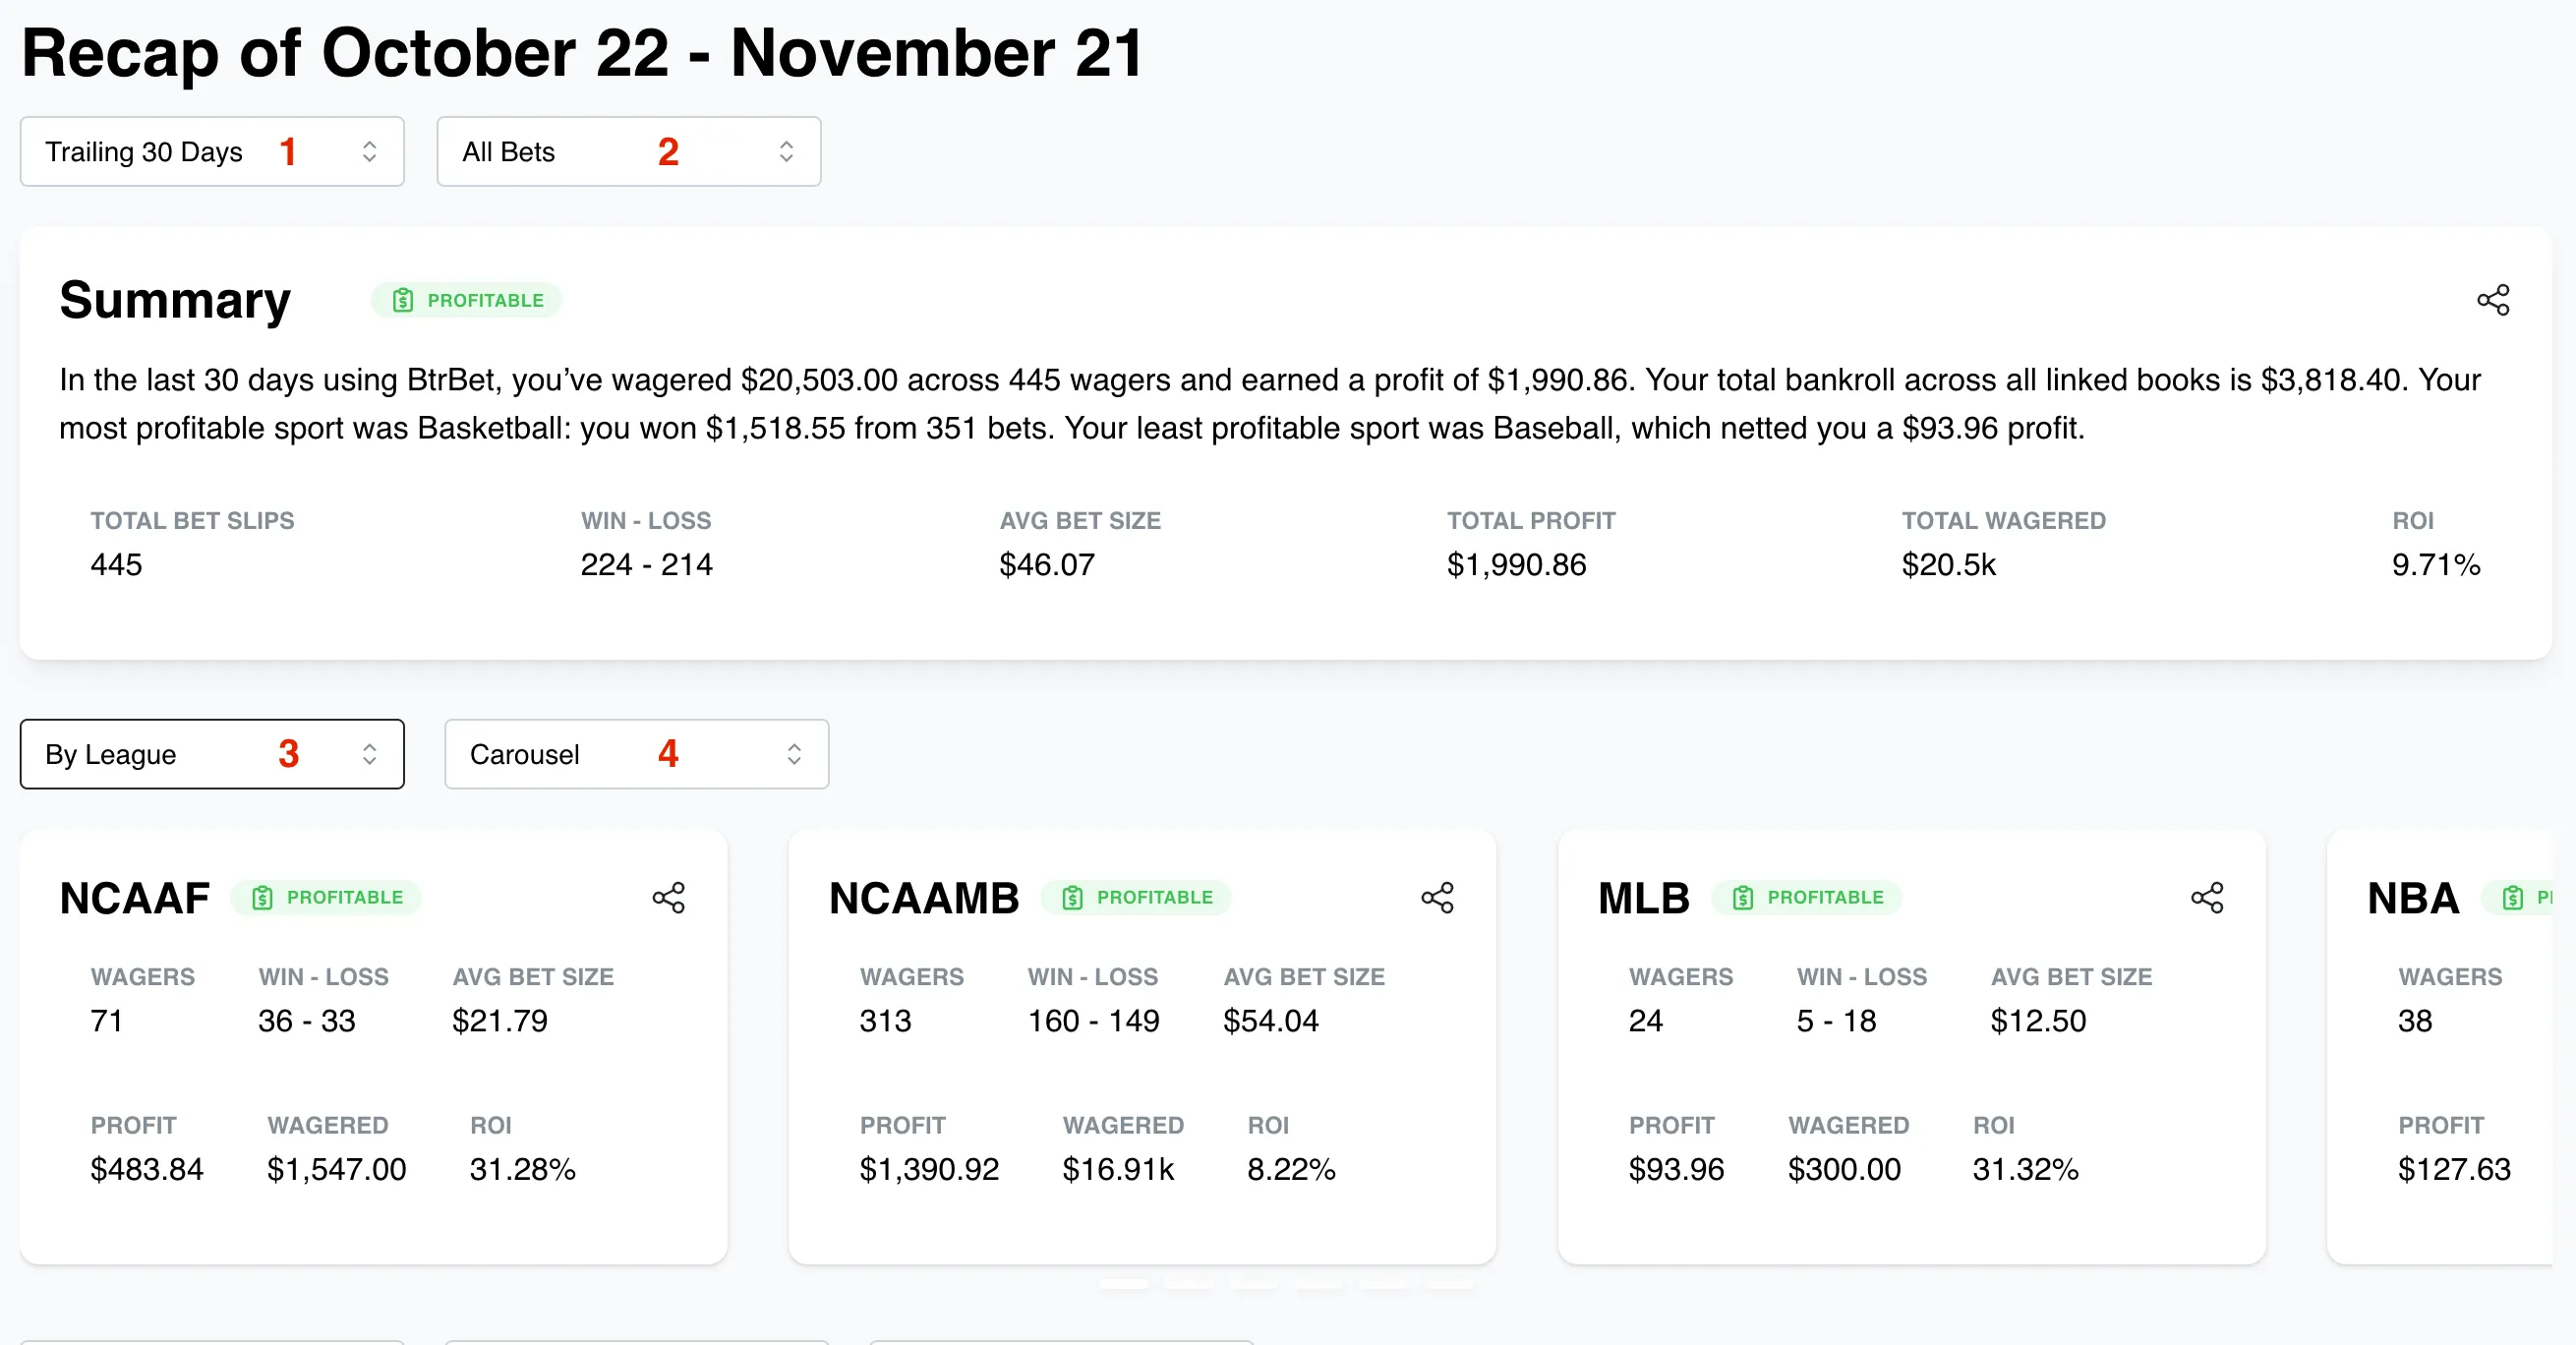
Section titled “Summary view”This section of your Recap shows you the top-level summary of your betting activity over the selected time range, filtered and sliced as you choose.

1. Time range: Select the time range you’d like to view a Recap of.
2. Tag filter: Filter your Recap to only show the bets from the selected time range that have the selected tag applied. You can add tags to your pending bets in your Snapshot.
3. Grouping selector: Select the property you’d like to group your betting data by. Group by sport, league, market, book, or bet type.
4. Grouping view selector: View your grouped analyses in a carousel or as a grid.
Time-series charts
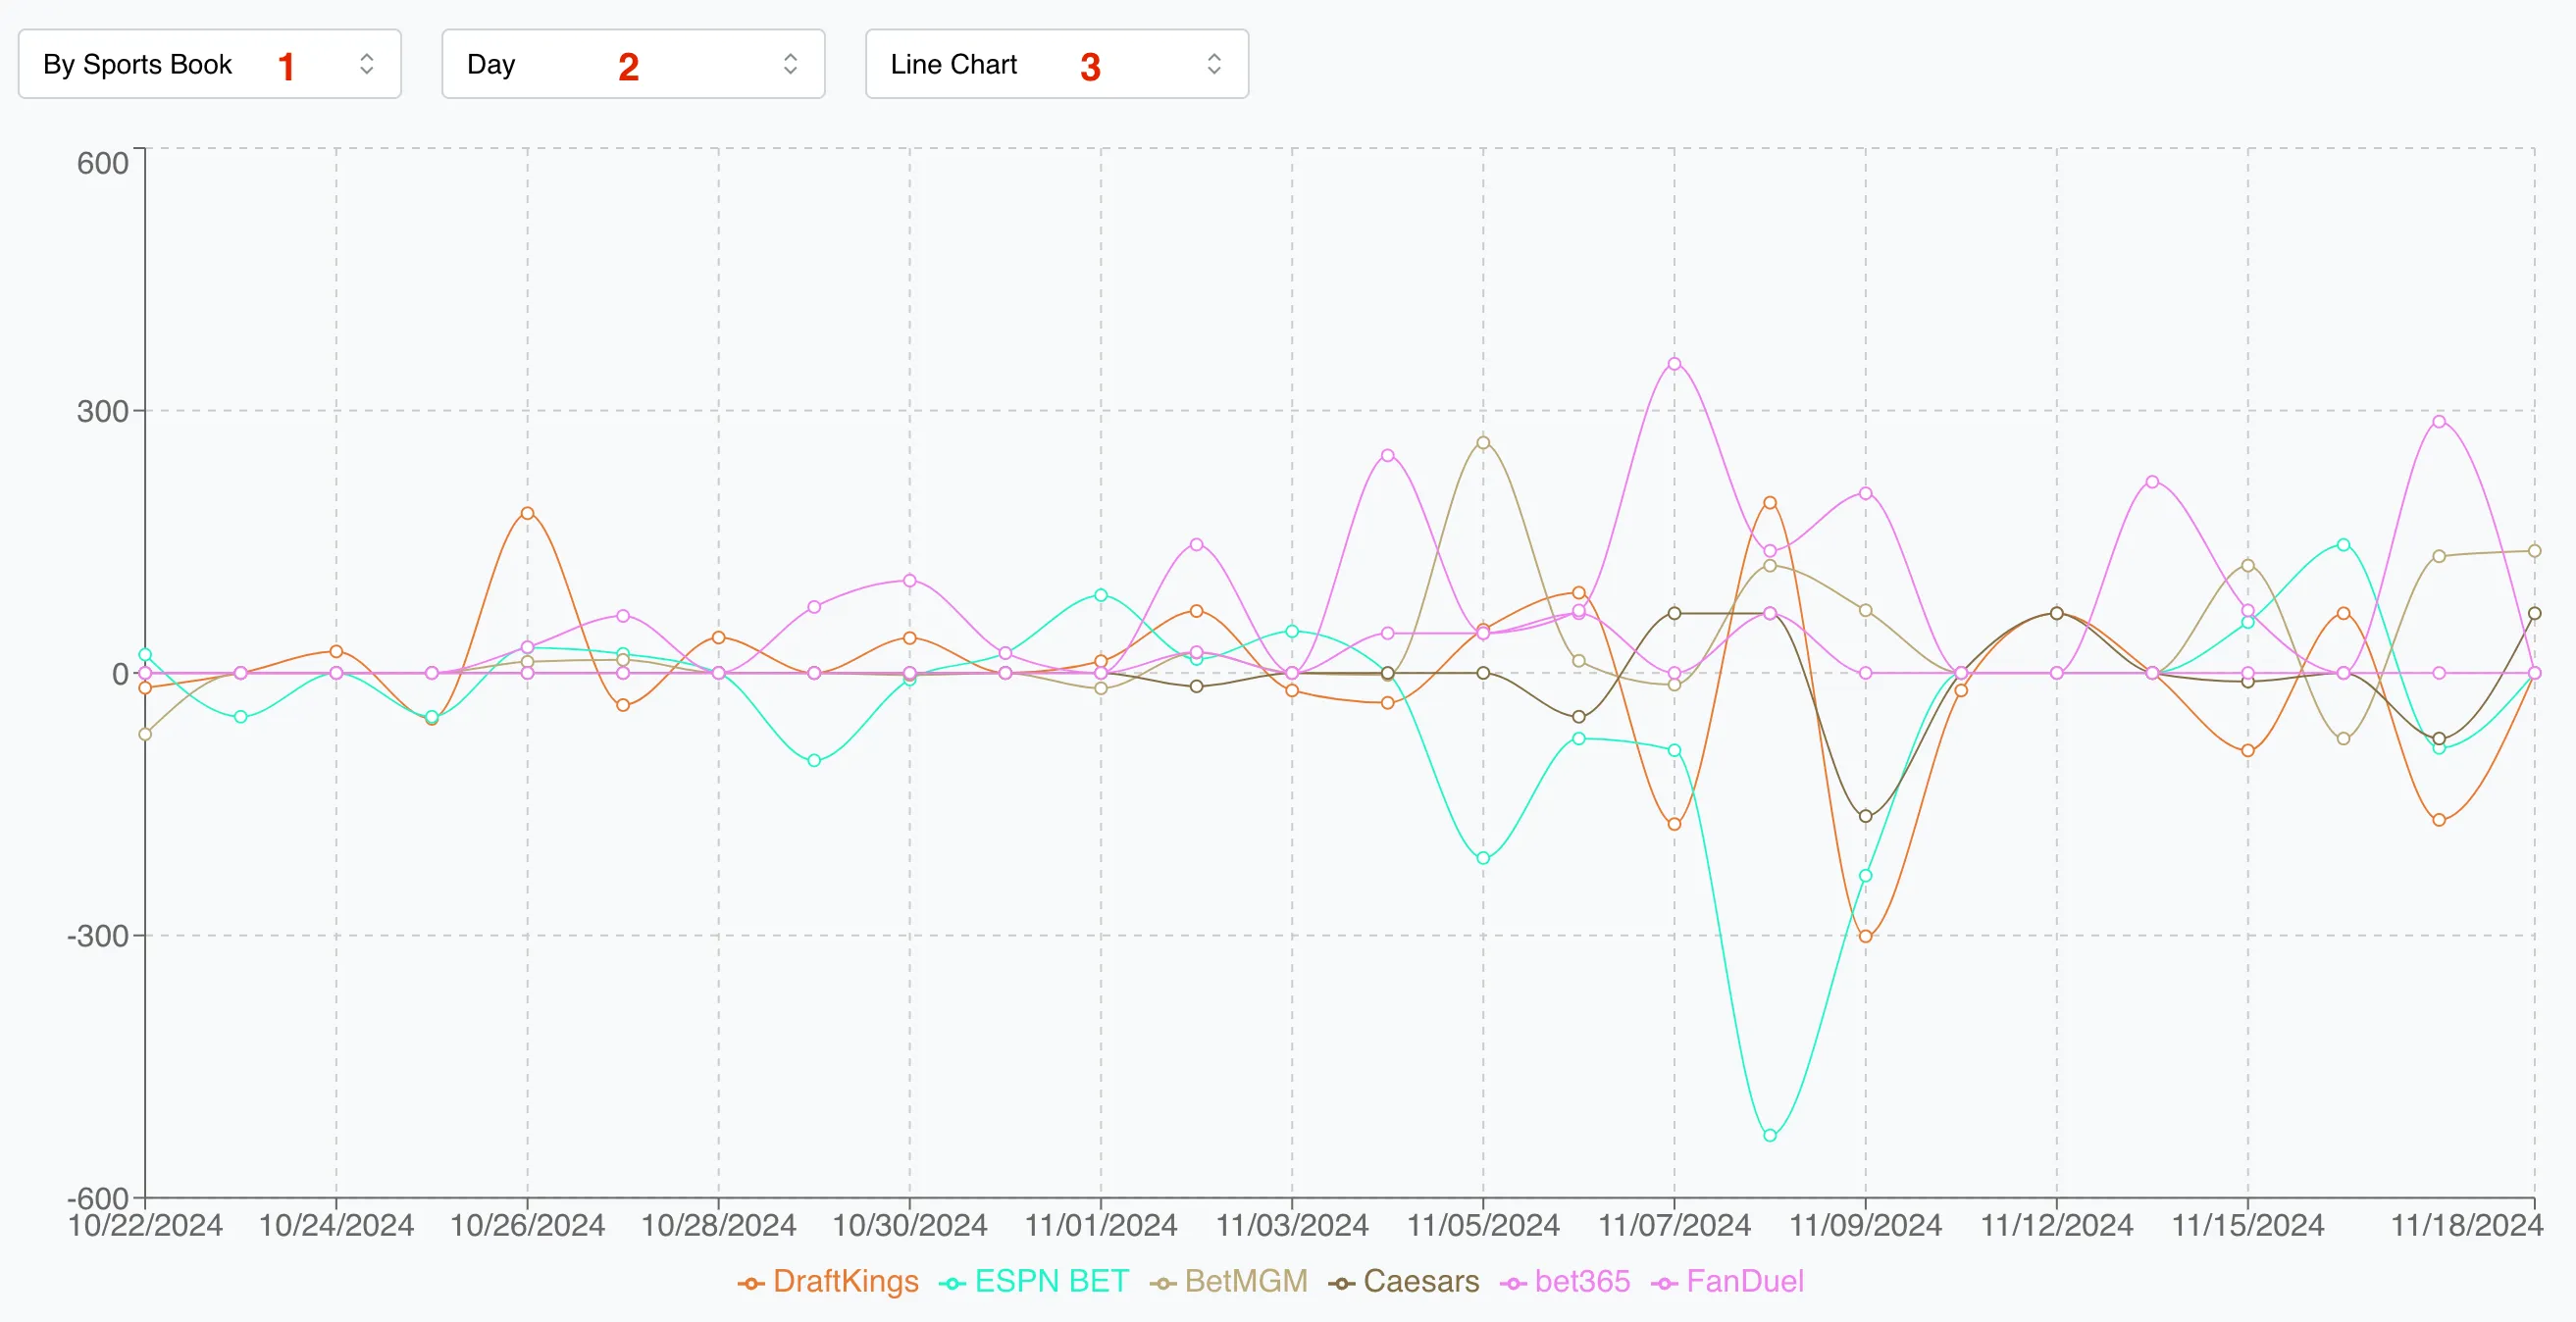
Section titled “Time-series charts”View a chart of your performance over time and find patterns in your performance.

1. Grouping selector: Select the property you’d like to group your betting data by. Group by sport, league, market, or book.
2. Time bucketing selector: Select the amount of time you’d like your data grouped by. View your performance bucketed by day, week, or month. The options available will depend on the time range selected at the top of your Recap.
3. Chart type selector: View your grouped and bucketed data as a line chart or bar chart.
Odds range breakdown
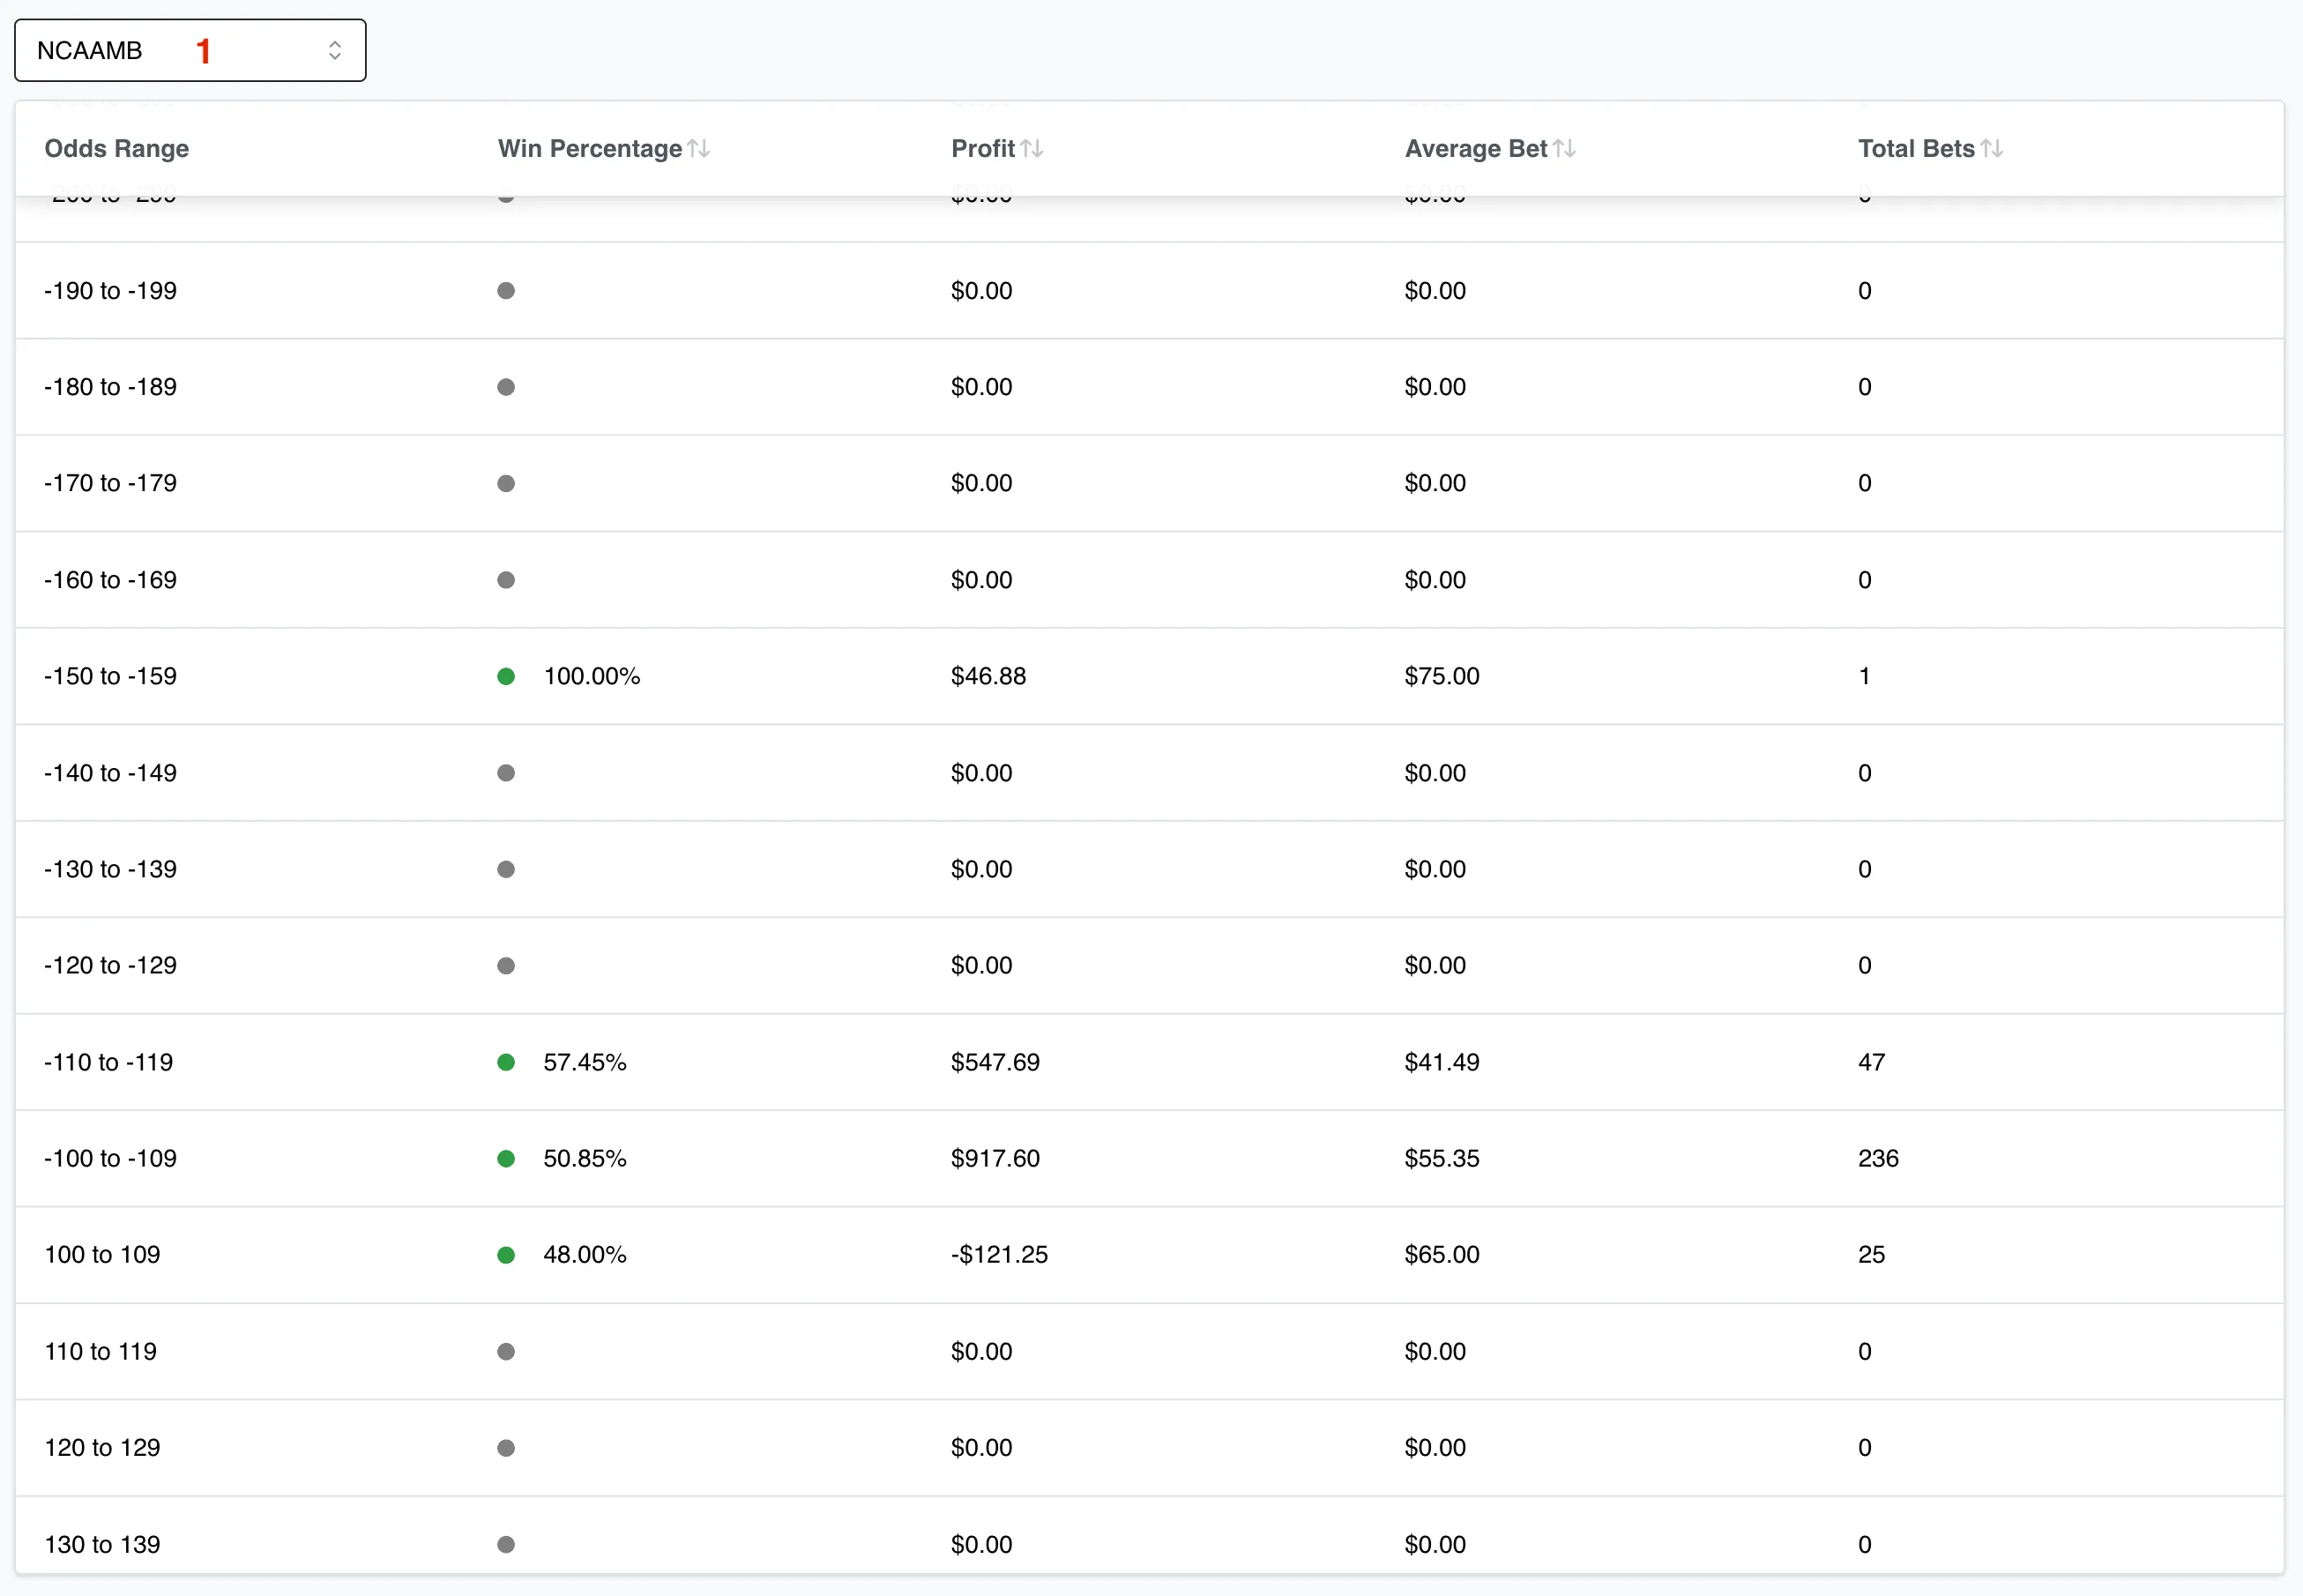
Section titled “Odds range breakdown”View a breakdown of your selected bets across odds ranges to see where you are likely long-term profitable and where you’re unlikely to be long-term profitable.

1. Bet filter: Select a single book, sport, league, or market to see a breakdown by odds range for that subset of your bets over the time range selected at the top of your Recap.
Data export
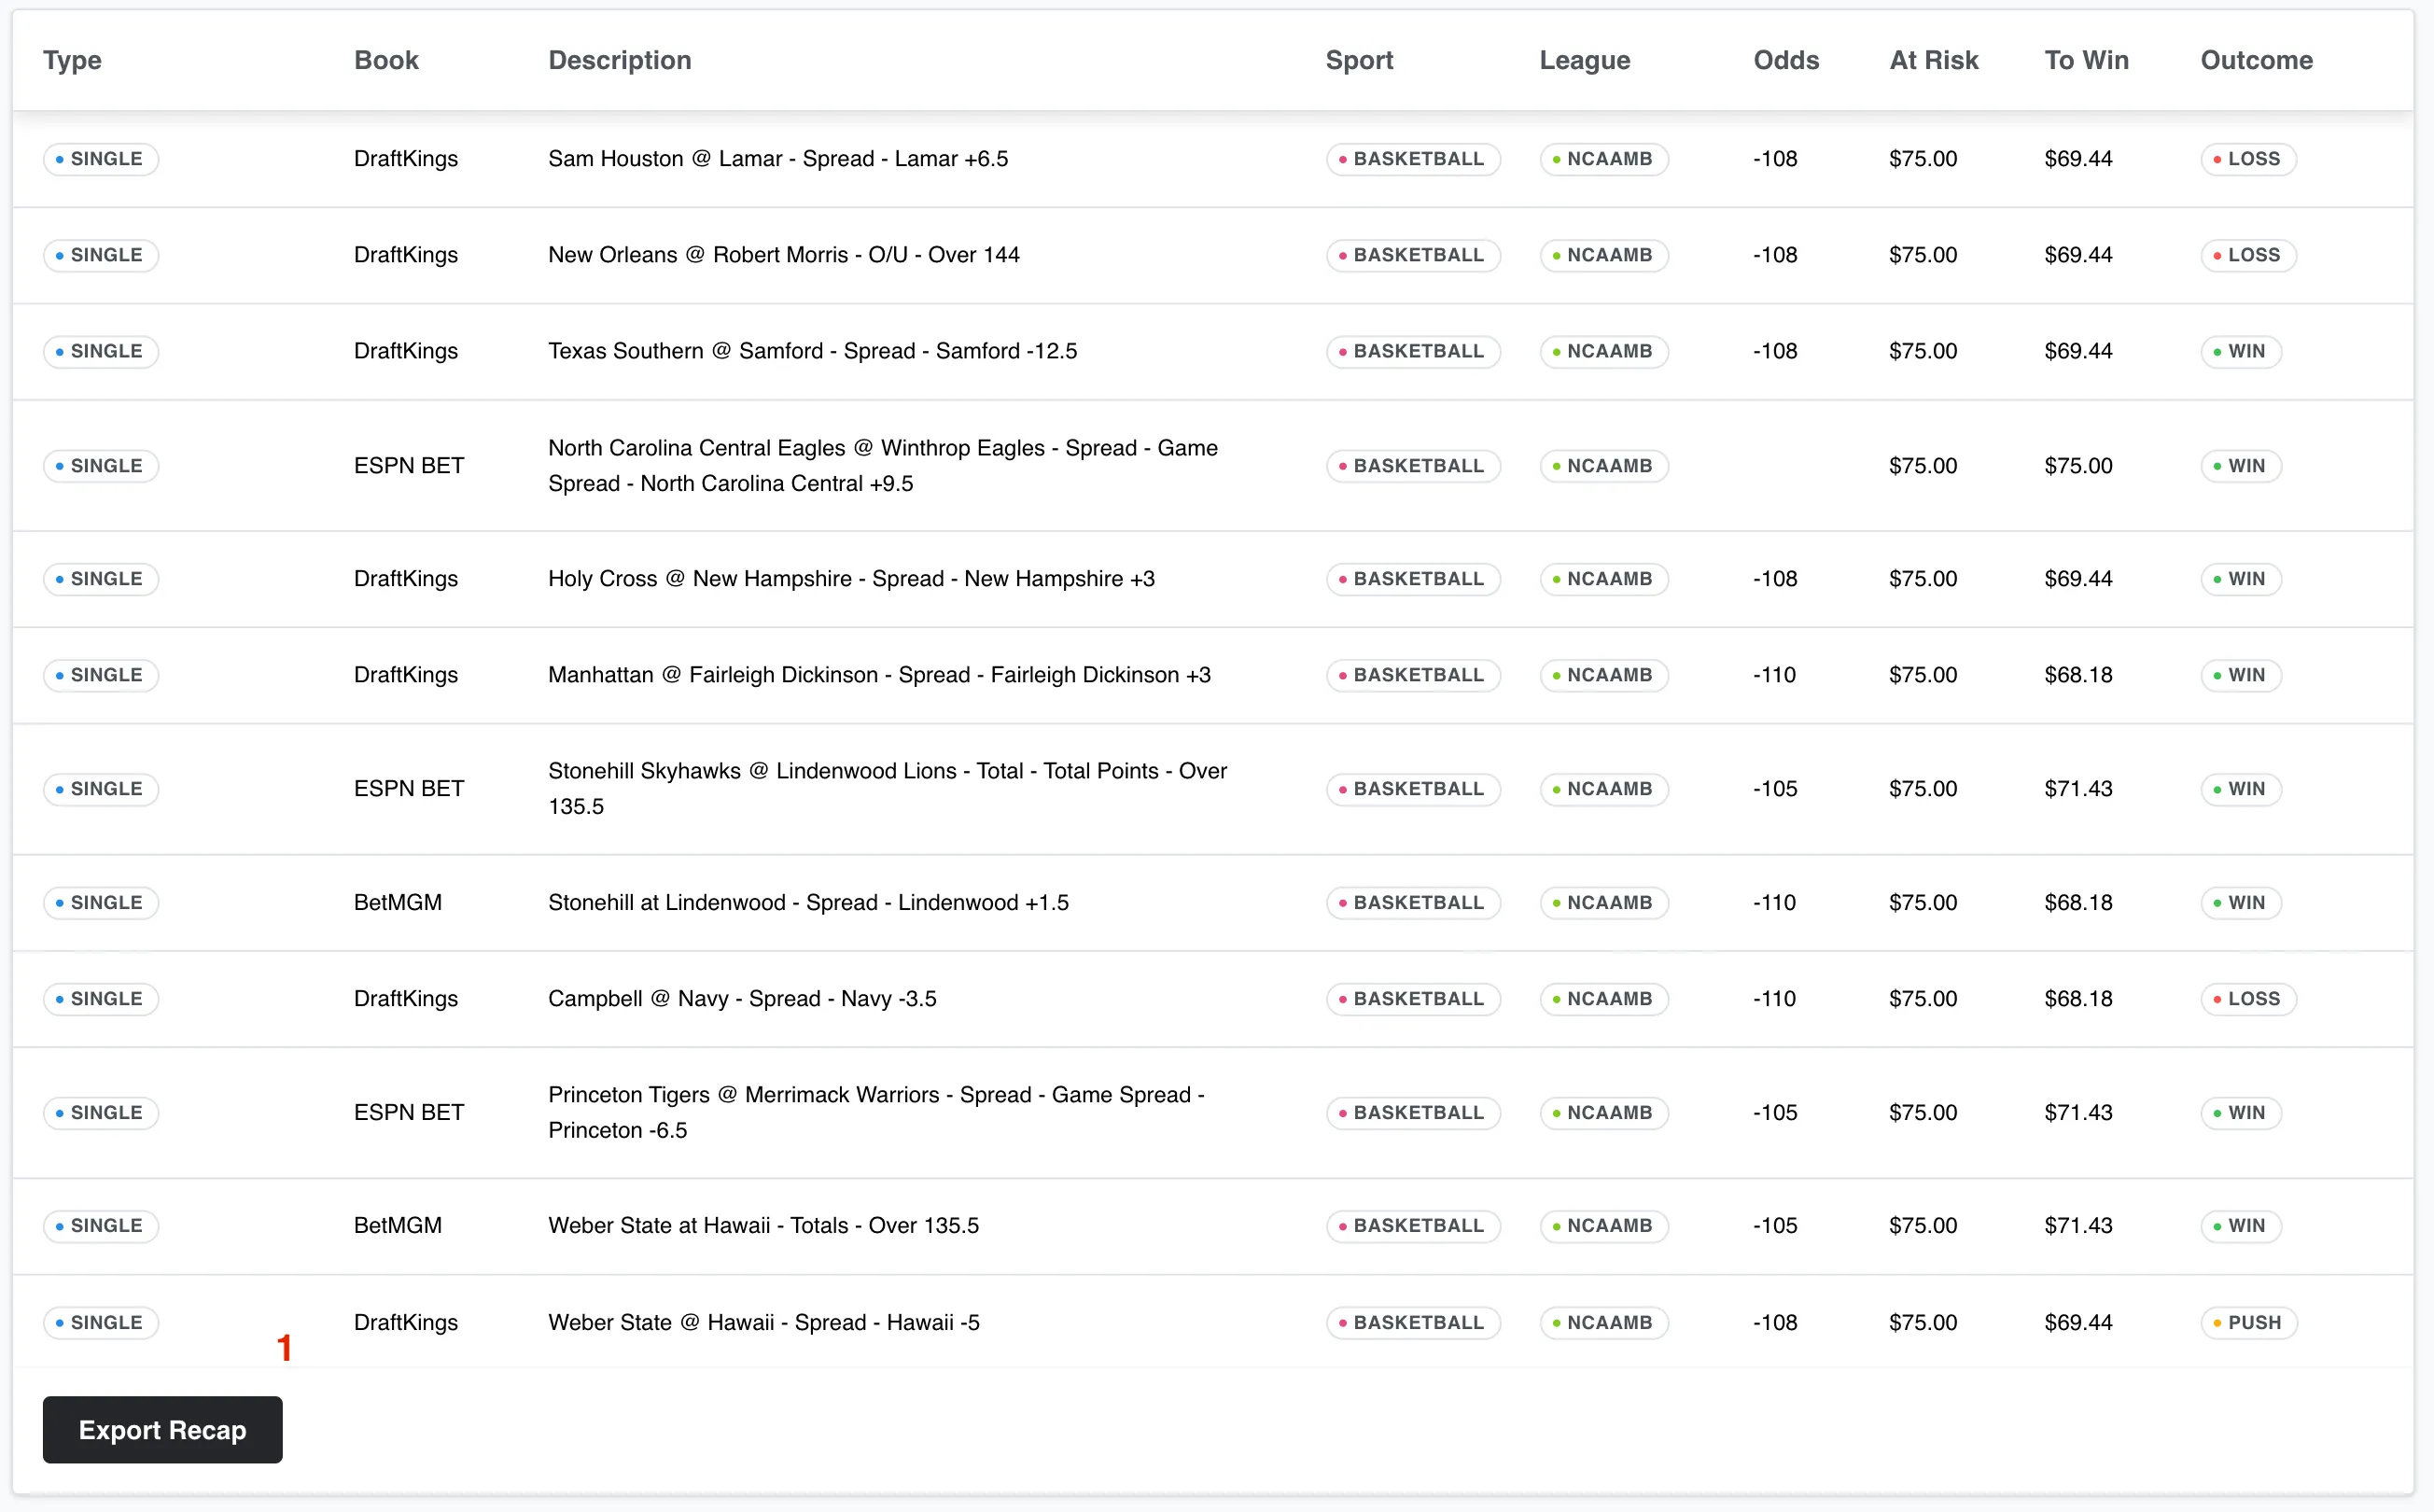
Section titled “Data export”See a listing of all the bets used to create the Recap that you’re currently viewing. This listing will show all of your bets that settled in the time range selected at the top of your Recap.

1. Export Recap: Use this button to export a CSV with all the data that BtrBet has on every bet in the listing. An export specifically for tax-prep purposes can be found the Tax Prep section of your BtrBet Dashboard.
Turn your betting history into strategy
Section titled “Turn your betting history into strategy”Utilize BtrBet’s Recap feature to analyze your betting performance through summary views, time-series charts, and odds range breakdowns. Identify patterns, refine your approach, and make data-driven decisions for future bets.
Get started for free